
Wentz Weekly Insights
Nvidia Overtakes Microsoft As World’s Most Valuable Company
Another week another record high for the major index. The S&P 500 is now higher in eight of the past nine weeks, rising 10% over that period, after a 0.61% increase in last week’s holiday shortened week. The Nasdaq was an underperformer for the first time in several weeks, after a weaker close to the week by Nvidia.
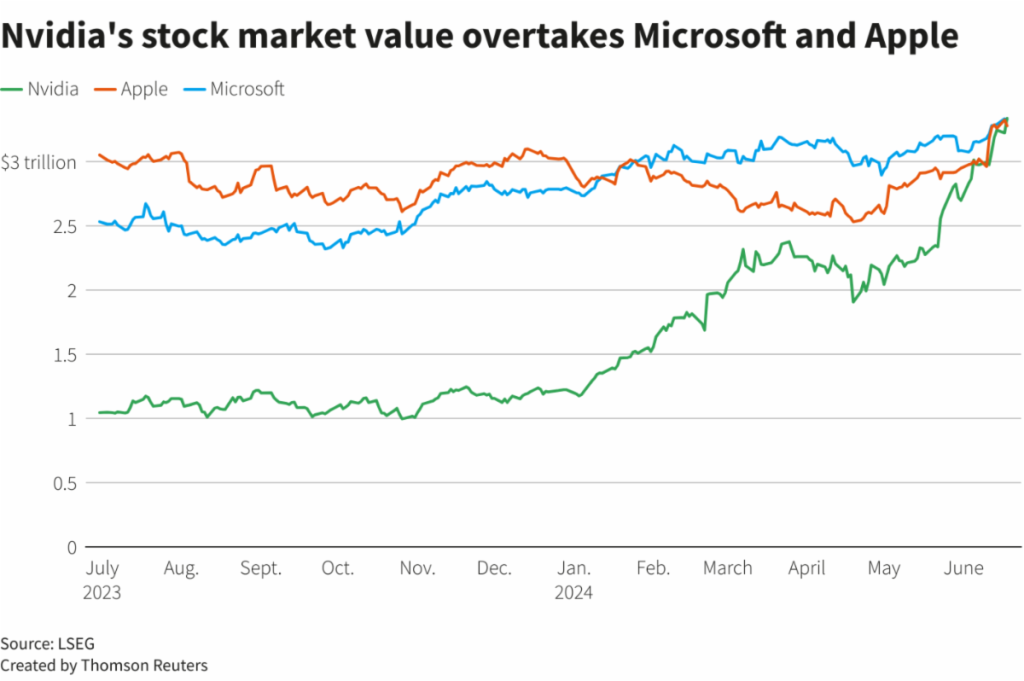
It wasn’t how the week started for Nvidia though. After a 2.8% gain to start the week, Nvidia became the world’s most valuable with a market cap of roughly $3.335 trillion, surpassing Microsoft for the first time. This came just days after surpassing Apple to become the second most valuable company.
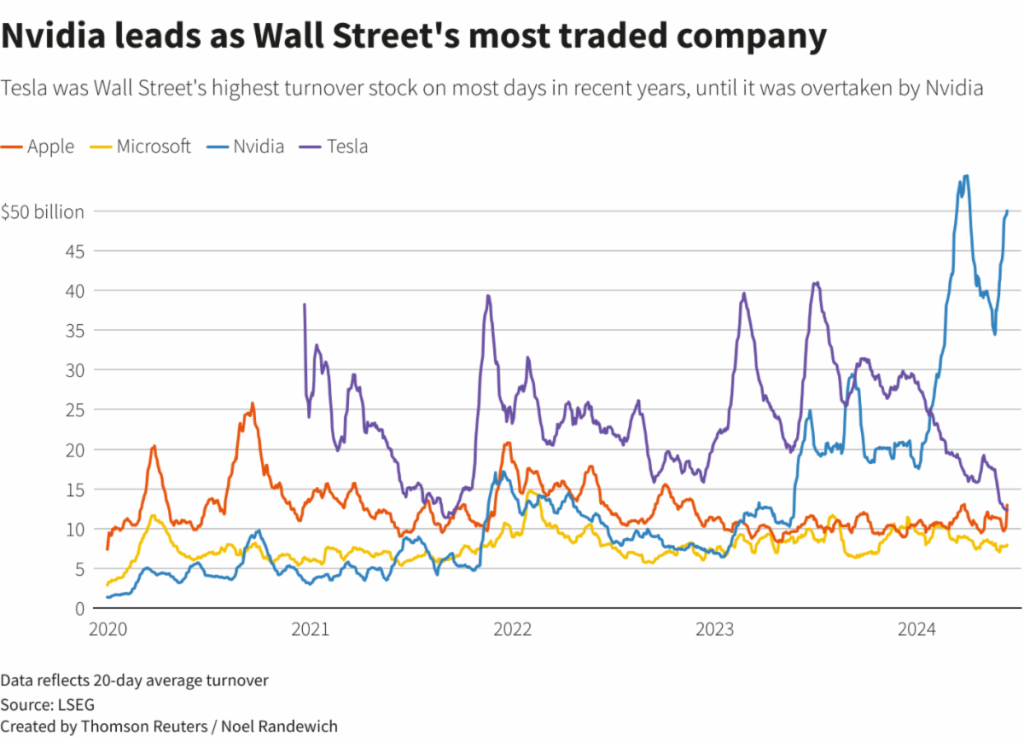
According to Reuters, Nvidia has dominated as the most traded company in US markets. The stock has seen daily turnover averaging $50 billion per day, this compares with Apple’s average daily turnover of about $10 billion. Nvidia’s trading now accounts for about 16% of all trading in S&P 500 companies. The top traded company since 2021 was Tesla by a wide margin, with its turnover averaging around $25 billion to $30 billion during that time, before its shares tumbled to start 2024.
Nvidia’s market cap took nine months to go from $1 trillion to $2 trillion from May 2023 to February 2024, and took just three months to gain the next $1 trillion. Last Tuesday’s gain of 3.5% was enough to add $110 billion to its market cap, roughly equal to the whole market cap of companies like Citigroup, Boeing, and UPS.
Outside of the continued momentum in AI related companies, it was a relatively quiet week. With that being said there was greater focus on economic data for the week. Data included updates on the housing market where home sales remain weak. The number of housing starts (to build a new home) and permits for new builds are down nearly 20% and 10%, respectively, from a year ago, both back near the lowest levels of the pandemic. Existing home sales also fell in May and are 3% lower from a year ago. The issue in the housing market continues to be the lack of inventory on the market as many locked in a low mortgage rate during the pandemic and are reluctant to potentially move and take on a higher rate. Meanwhile, homebuilder sentiment fell to near the lowest level of the pandemic as well.
The other main data release was May retail sales. Again, sales disappointed with a 0.1% decline in sales in the month, much less than the 0.3% increase expected. Of the 13 major spending categories, 8 of them saw sales declines, led by gasoline, furniture, and building material sales, with strength in sporting goods, apparel, and vehicle sales. After adjusting for the 3.3% rise in prices/inflation, real retail sales are down 1.0% over the past 12 months.
There are clear signs of consumers being more careful in how they spend, particularly on goods, while services such as vacationing remains strong. We will see more data on the consumer this week on Friday with May consumer spending data, income data, as well as the Fed’s preferred inflation reading with the PCE price index.
For the week the major US stock indexes finished as follows: Dow +1.45%, Russell 2000 +0.79%, S&P 500 +0.61%, and Nasdaq +0.00%. The Treasury market was relatively unchanged with the 2-year Treasury yield rising 2 basis points to 4.74% while the 10-year yield rose 3 basis points to 4.26%. The dollar index saw another increase, rising 0.24%, while gold fell 0.7%. Crude oil finished strong with a 3.4% gain on no specific news, beside a bit of optimism on consumer demand for the summer months.
Recent Economic Data
-
Retail Sales: U.S. retail sales rose 0.1% in May, less than the 0.3% increase expected. Even more of a disappointment, sales for April were revised downward to a 0.2% decline after initially estimated to show no change. For May, retail sales excluding gasoline sales and vehicle sales rose 0.1%, still below the 0.3% expected. In the month 8 of the 13 major categories saw sales increases and results across categories were widely mixed. The strongest growth was seen in sporting goods stores with a 2.8% increase, followed by apparel +0.9%, vehicles +0.8%, and online sales +0.8%, while declines were seen in gasoline sales -2.2%, furniture -1.1%, and building materials -0.8%. Sales are up just 2.3% from a year ago, but after accounting for inflation of 3.3%, sales are down 1.0% over the past 12 months. Further evidence of consumer spending fatigue/slowdown is retail sales are down at a 0.1% annualized rate through the first five months of the year.
-
Housing Starts & Permits: Housing starts and permits were another disappointment – The number of housing starts in the U.S. dropped 5.5% in May to a seasonally adjusted annualized rate of 1.277 million, well below the 1.370 million expected, and 19.3% below the year ago number. The number of permits filed for new home builds fell 3.8% to a seasonally adjusted annualized rate of 1.386 million, also below the 1.450 million expected and 9.5% lower than a year ago. The pace of starts and permits are now back near the lowest levels of the pandemic. In a housing market that faces massive shortages, builders just aren’t building enough and it seems to be worsening – the number of homes under construction is down 5% since the beginning of the year.
-
Existing Home Sales: Existing home sales declined slightly in May to a seasonally adjusted annualized rate of 4.110 million homes, a decline of 2.8% from a year ago. Sales fell in the South but were unchanged in the three other regions. Sales of homes priced $1 million and above have increased 23% over the past year versus the 2.8% decline for all homes. Inventory improved somewhat, rising 7% in May to 1.28 million units, and up 18.5% from a year ago, but that was not enough to stop the increase in home prices. The median home price increased 5.8% from a year ago to $419,300.
Housing Market Index: The housing market index, an index measuring homebuilder sentiment, fell again in June to the worst level of the year to an index level of 43, down from 45 from May and the 12-month high of 51 in April as home builder sentiment deteriorates as summer begins. Sentiment is positive in the northeast, but depressed in the West and to a lesser degree the south and Midwest. The index of present sales was 48, the index of expectations over the next six months was 47, and the index of traffic of potential buyers was 28, all the lowest levels of the year. -
Mortgage Rates: The average 30-year prime mortgage rate fell another 8 basis points last week to 6.87%, the lowest since the beginning of April, after reaching a late spring high of 7.22%. The average 30-year rate peaked at 7.79% last October then fell to a low of 6.60% in January.
-
Empire State Manufacturing Survey: The Empire State Manufacturing index was -6.0 for the June survey, suggesting a slower contraction from the -15.6 index level in May, but still indicating weak manufacturing conditions in the New York region. New orders didn’t change much while employment and hours worked continued to decline. The pace of input and selling prices moderated slightly for the second straight month.
-
Philly Fed Manufacturing Survey: The Philly Fed manufacturing index was also lower than expected, coming in at 1.3, below 5.2 expected but still indicating steady manufacturing conditions in June. New orders and shipments remained negative, with employment negative for the eighth straight month, while prices paid continued to indicated overall price increases. Future activity indicators were positive with widespread expectations for growth over the next six months.
-
Industrial Production: Industrial production in the U.S. saw a big boost, rising 0.9% in the month which was well above the 0.3% increase expected. The increase was due to all industries including a strong 0.9% increase in manufacturing, after three declines in the last four months, a 0.3% increase in mining, and a 1.6% increase in utilities which is highly correlated to weather.
-
Jobless Claims: The number of unemployment claims filed the week ended June 15 was 238,000, a decline of 5k from the week prior which was the highest level in several months. The four-week average is 232,750. The number of continuing claims was 1.828 million, up 15k from the prior week, and back to the highest level since falling from the pandemic spike (November 2021), with the four-week average up 10k to 1.805 million.
Company News
-
Apple Changes: Apple is reportedly ending its buy now pay later services that it launched just a year ago. Instead, when checking out with Apple Pay, it will now offer installment loans through third party Affirm, and will begin offering credit and debit cards later this year. Separately, it is reported by the Information that Apple is suspending its work on its next version of the more expensive Vision headset, due to the lack of demand and slowing sales of its first version, and instead focusing its attention on its more affordable version.
-
Meta/Apple Partnership?: Meta Platforms, Facebook parent company, has reportedly held talks with Apple about integrating its generative AI model into Apple Intelligence, Apple’s new AI system for its devices. Meta is hoping to take advantage of Apple’s massive user base through its iPhones and other devices. The report by the Wall Street Journal adds if Apple partners with Meta or another generative AI service, Apple users would be able to choose which external AI models to use. Neither party is expected to pay the other, rather the AI companies would be given the option to sell premium subscriptions to their services through Apple Intelligence, and as Apple does on its app store, it would receive a portion of the cost.
-
Fisker Bankruptcy: EV maker Fisker has filed for Chapter 11 bankruptcy and is aiming to sell assets, coming after warning in February its ability to continue as a going concern. Earlier in the year it failed to secure an investment from a major automaker, and has dealt with investigations in some of its models.
-
Penn Merger: Boyd Gaming has reportedly approached Penn Entertainment about a potential takeover, although the report says it’s not clear if Penn would agree to hold deal talks. A potential merger would probably require support from Disney given its partnership between Penn and ESPN.
Other News:
-
Investor Sentiment At A High: The latest BoA fund manager survey showed investor sentiment is the most bullish since November 2021, the previous market high before stocks saw their last large decline, although it added sentiment is not at extreme levels. It added that fund managers cash levels are at about 4.0%, the lowest since June 2021, and investors are the most overweight stocks and underweight bonds since November 2022.
-
Biden & Oil: The White House energy advisor said Biden is ready to draw from the Strategic Petroleum Reserve (SPR) again if oil prices surge again. He received a lot of criticism for doing so last time.
Did You Know…?
CBO Raises Deficit Projections:
The Congressional Budget Office released its new Budget and Economic Outlook for 2024 to 2034. In its projections, the federal deficit is projected to reach $1.9 trillion in fiscal year 2024, up by $400 billion, or 27%, compared to the February projections. Outlays are projected to reach $6.88 trillion for the fiscal year, led by mandatory spending like social security and Medicare, as well as a larger increase in net interest expense, while revenues are expected to total $4.89 trillion. In addition, the cumulative deficit through 2034 is expected to be $2.1 trillion, or 10%, larger than the prior estimate. The higher projection is due to recent legislation including emergency supplemental appropriations that provide $95 billion in aid to Ukraine, Israel, and Indo-Pacific countries, of which will increase the deficit by $900 billion through 2034. By 2034, the deficit is projected to equal 6.9% of GDP with net interest payments equaling 4.1% of GDP, or about one-sixth of all federal spending. The Federal debt is projected to reach 122% of GDP by 2034, up from 99% of GDP in 2024.
WFG News
Regulatory Mailings
ADV / Client Access: Please be aware, Raymond James will soon be distributing ADV disclosures to all clients. This is a 100+ page disclosure document about the company and investment advisor services. To help us reduce the use of paper and to avoid receiving the lengthy document, you can elect to receive this document electronically. To do so:
- For users with client access: Log into your Client Access account and make sure you select you want to receive documents electronically under “other correspondence.”
- For users without Client Access: You may or may not receive a copy electronically, depending on your account opening documents. If you want to confirm you will receive a physical copy, please contact us. If you would like to receive this electronically, please call our office at 330-650-2700 and we will be happy to update our system to have the document e-mailed to you.
The Week Ahead
The main focus on the economic calendar this week will be Friday’s release of the PCE price index where current consensus sees the Fed’s preferred inflation reading unchanged in the month after a 0.3% increase in April, with core prices rising 0.1%. The report also includes an update on consumers’ income and spending growth. Other data releases involve the housing market with the S&P Case Shiller home price index, new home sales, and the pending home sales index, as well as durable goods orders for May, jobless claims, and consumer sentiment indicators. There are many Fed speakers taking place this week, most of which will occur the first half of the week. On the corporate side, there are several notable earnings including from Carnival Cruise, FedEx, General Mills, Micron, Walgreens, and Nike. Politics comes back into the picture with the first Presidential debate taking place on Thursday, hosted by CNN.
